GaugeChart
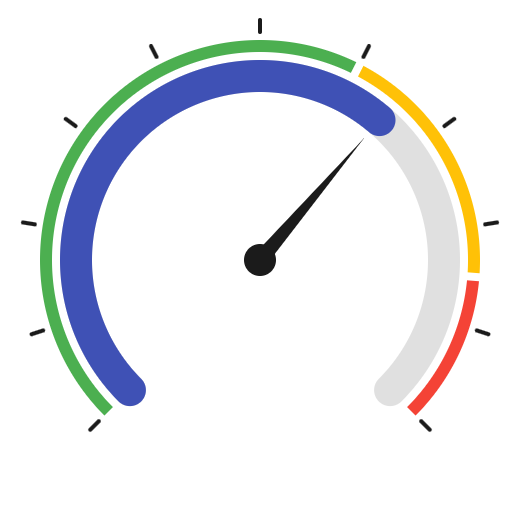
A gauge made of one or more rings bent along an arc, with optional ticks, markers and pointers.
It can be drawn as a progress indicator, an activity-style set of concentric rings, or a speedometer with colored zones and a needle.
Example:
fch.GaugeChart(
    min_value=0,
    max_value=100,
    rings=[fch.GaugeProgressRing(value=72, bgcolor=ft.Colors.BLACK_12)],
    pointers=[fch.GaugeNeedlePointer(value=72)],
)
To show content in the middle of the gauge, such as the current value, place
the chart and the content in an Stack.
Inherits: LayoutControl
Properties
animation- Controls the implicit animation applied when updating this chart.border- The border drawn around this chart.default_ring_width- The width of the rings whoseGaugeRing.widthisn't set, in logical pixels.direction- The direction in which the arc travels fromstart_degree_offset.interactive- Enables touch interactions and event notifications.long_press_duration- The duration before a long-press event fires.markers- The markers drawn along the arc, each at its own value.max_value- The highest value of the gauge's scale, at the end of the arc.min_value- The lowest value of the gauge's scale, at the start of the arc.pointers- The pointers drawn on top of the gauge, in order.rings- The rings of this gauge, from the innermost to the outermost.rings_space- The gap between adjacent rings, in logical pixels.start_degree_offset- The angle at which the arc starts, in degrees.sweep_angle- The length of the arc, in degrees.ticks- The tick marks drawn along the arc.
Events
on_event- Called when the chart is interacted with.
Examples
Speedometer
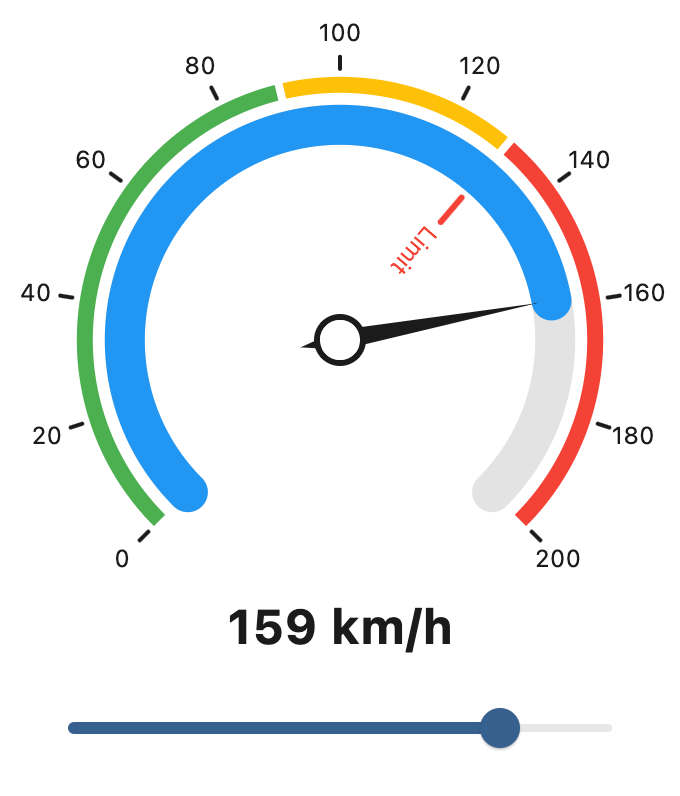
A progress ring and a needle follow the slider, over a ring of speed zones, labeled ticks and a marker at the speed limit.
import flet as ft
import flet_charts as fch

MIN_SPEED = 0
MAX_SPEED = 200
SPEED_LIMIT = 130


def main(page: ft.Page):
    def handle_speed_change(e: ft.Event[ft.Slider]):
        speed.value = needle.value = e.control.value
        reading.value = f"{e.control.value:.0f} km/h"

    page.add(
        ft.SafeArea(
            content=ft.Column(
                horizontal_alignment=ft.CrossAxisAlignment.CENTER,
                controls=[
                    ft.Stack(
                        width=320,
                        height=320,
                        alignment=ft.Alignment.BOTTOM_CENTER,
                        controls=[
                            fch.GaugeChart(
                                min_value=MIN_SPEED,
                                max_value=MAX_SPEED,
                                rings_space=6,
                                rings=[
                                    speed := fch.GaugeProgressRing(
                                        value=60,
                                        width=20,
                                        color=ft.Colors.BLUE,
                                        bgcolor=ft.Colors.with_opacity(
                                            0.12, ft.Colors.ON_SURFACE
                                        ),
                                        stroke_cap=ft.StrokeCap.ROUND,
                                    ),
                                    fch.GaugeZonesRing(
                                        width=8,
                                        zones_space=4,
                                        zones=[
                                            fch.GaugeZone(0, 90, ft.Colors.GREEN),
                                            fch.GaugeZone(90, 130, ft.Colors.AMBER),
                                            fch.GaugeZone(130, 200, ft.Colors.RED),
                                        ],
                                    ),
                                ],
                                ticks=fch.GaugeLineTicks(
                                    count=11,
                                    offset=4,
                                    labels=[str(v) for v in range(0, 201, 20)],
                                    label_style=ft.TextStyle(size=12),
                                    label_offset=4,
                                ),
                                markers=[
                                    fch.GaugeMarker(
                                        value=SPEED_LIMIT,
                                        position=fch.GaugeTickPosition.INNER,
                                        offset=12,
                                        length=16,
                                        thickness=3,
                                        color=ft.Colors.RED,
                                        label="Limit",
                                    )
                                ],
                                pointers=[
                                    needle := fch.GaugeNeedlePointer(
                                        value=60, length=100, width=10, tail_length=20
                                    ),
                                    fch.GaugeCirclePointer(
                                        value=0,
                                        radius=10,
                                        color=ft.Colors.SURFACE,
                                        stroke_width=3,
                                        stroke_color=ft.Colors.ON_SURFACE,
                                    ),
                                ],
                            ),
                            reading := ft.Text(
                                "60 km/h", size=24, weight=ft.FontWeight.BOLD
                            ),
                        ],
                    ),
                    ft.Slider(
                        key="speed",
                        width=320,
                        min=MIN_SPEED,
                        max=MAX_SPEED,
                        value=60,
                        on_change=handle_speed_change,
                    ),
                ],
            )
        )
    )


if __name__ == "__main__":
    ft.run(main)
Activity rings
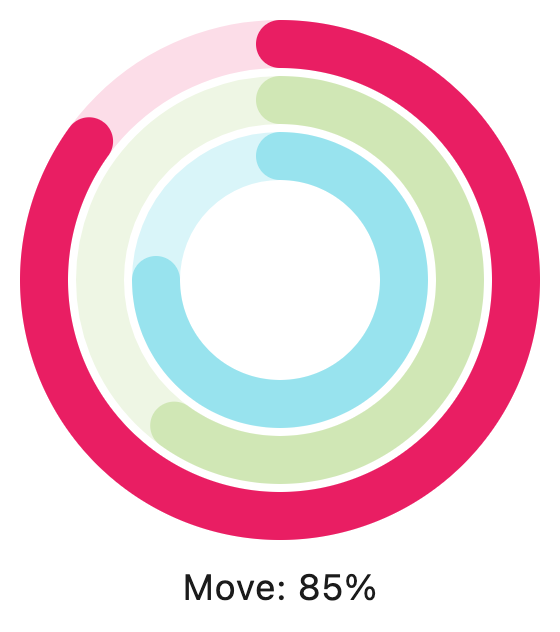
Three full-circle progress rings share one scale. Hovering or tapping a ring highlights it and shows its progress below the chart.
import flet as ft
import flet_charts as fch

ACTIVITIES = [
    ("Stand", 75, ft.Colors.CYAN),
    ("Exercise", 60, ft.Colors.LIGHT_GREEN),
    ("Move", 85, ft.Colors.PINK),
]


def main(page: ft.Page):
    def handle_chart_event(e: fch.GaugeChartEvent):
        for index, ring in enumerate(chart.rings):
            color = ACTIVITIES[index][2]
            ring.color = (
                color
                if e.ring_index in (None, index)
                else ft.Colors.with_opacity(0.3, color)
            )
        if e.ring_index is None:
            caption.value = "Hover a ring"
        else:
            name, goal, _ = ACTIVITIES[e.ring_index]
            caption.value = f"{name}: {goal}%"

    page.add(
        ft.SafeArea(
            content=ft.Column(
                horizontal_alignment=ft.CrossAxisAlignment.CENTER,
                controls=[
                    chart := fch.GaugeChart(
                        width=260,
                        height=260,
                        max_value=100,
                        start_degree_offset=-90,
                        sweep_angle=360,
                        default_ring_width=24,
                        rings_space=4,
                        on_event=handle_chart_event,
                        rings=[
                            fch.GaugeProgressRing(
                                value=value,
                                color=color,
                                bgcolor=ft.Colors.with_opacity(0.15, color),
                                stroke_cap=ft.StrokeCap.ROUND,
                            )
                            for _, value, color in ACTIVITIES
                        ],
                    ),
                    caption := ft.Text("Hover a ring", size=18),
                ],
            )
        )
    )


if __name__ == "__main__":
    ft.run(main)
Properties
animationclass-attributeinstance-attribute
animation: AnimationValue = field(
    default_factory=lambda: Animation(
        duration=Duration(milliseconds=150),
        curve=AnimationCurve.LINEAR,
    )
)
Controls the implicit animation applied when updating this chart.
borderclass-attributeinstance-attribute
border: Border | None = NoneThe border drawn around this chart.
default_ring_widthclass-attributeinstance-attribute
default_ring_width: Number = 10.0The width of the rings whose GaugeRing.width isn't set,
in logical pixels.
directionclass-attributeinstance-attribute
direction: GaugeDirection = GaugeDirection.CLOCKWISEThe direction in which the arc travels from start_degree_offset.
interactiveclass-attributeinstance-attribute
interactive: bool = TrueEnables touch interactions and event notifications.
long_press_durationclass-attributeinstance-attribute
long_press_duration: DurationValue | None = NoneThe duration before a long-press event fires.
markersclass-attributeinstance-attribute
markers: list[GaugeMarker] = field(default_factory=list)The markers drawn along the arc, each at its own value.
max_valueclass-attributeinstance-attribute
max_value: Number = 1.0The highest value of the gauge's scale, at the end of the arc.
min_valueclass-attributeinstance-attribute
min_value: Number = 0.0The lowest value of the gauge's scale, at the start of the arc.
pointersclass-attributeinstance-attribute
pointers: list[GaugePointer] = field(default_factory=list)The pointers drawn on top of the gauge, in order.
Each pointer is either a GaugeNeedlePointer or a
GaugeCirclePointer.
ringsclass-attributeinstance-attribute
rings: list[GaugeRing] = field(default_factory=list)The rings of this gauge, from the innermost to the outermost.
Each ring is either a GaugeProgressRing or a
GaugeZonesRing. All rings share the scale between
min_value and max_value.
Raises:
- ValueError - If an item of the list is a
GaugeProgressRingand itsvalueis not betweenmin_valueandmax_value, inclusive. - ValueError - If an item of the list is a
GaugeZonesRingand one of itszonesstarts beforemin_value. - ValueError - If an item of the list is a
GaugeZonesRingand one of itszonesends aftermax_value.
rings_spaceclass-attributeinstance-attribute
rings_space: Number = 0.0The gap between adjacent rings, in logical pixels.
Raises:
- ValueError - If it is not greater than or equal to
0.
start_degree_offsetclass-attributeinstance-attribute
start_degree_offset: Number = -225.0The angle at which the arc starts, in degrees.
0 points right and angles increase clockwise, so the default of -225,
together with the default sweep_angle, draws an arc open at the
bottom.
sweep_angleclass-attributeinstance-attribute
sweep_angle: Number = 270.0The length of the arc, in degrees.
Raises:
- ValueError - If it is not strictly greater than
0. - ValueError - If it is not less than or equal to
360.
ticksclass-attributeinstance-attribute
ticks: GaugeTicks | None = NoneThe tick marks drawn along the arc.
Either a GaugeLineTicks or a
GaugeCircleTicks. If None, no ticks are drawn.
Events
on_eventclass-attributeinstance-attribute
on_event: EventHandler[GaugeChartEvent] | None = NoneCalled when the chart is interacted with.